
DevOps Interview Questions and Answers
By Ilya Subach, DevOps engineer · Updated July 22, 2026
Stop reading, start practicing: Paste the job description, get a free tailored prep plan — no account.
Paste your JD →See a live demoThis guide is for engineers preparing for DevOps, platform, SRE, and cloud roles at any level — from a first junior screen to a senior loop with design and incident rounds. DevOps interviews cover unusually wide ground: Linux, scripting, containers, Kubernetes, Terraform, CI/CD, cloud, and monitoring can all appear in a single afternoon. This page is the map: what interviewers test at each seniority level, how the loop is structured, real questions with model answers across every domain, and a preparation plan. Where a topic deserves a full guide of its own — Kubernetes, Terraform, CI/CD, AWS, SRE — we point you to it rather than compressing it.
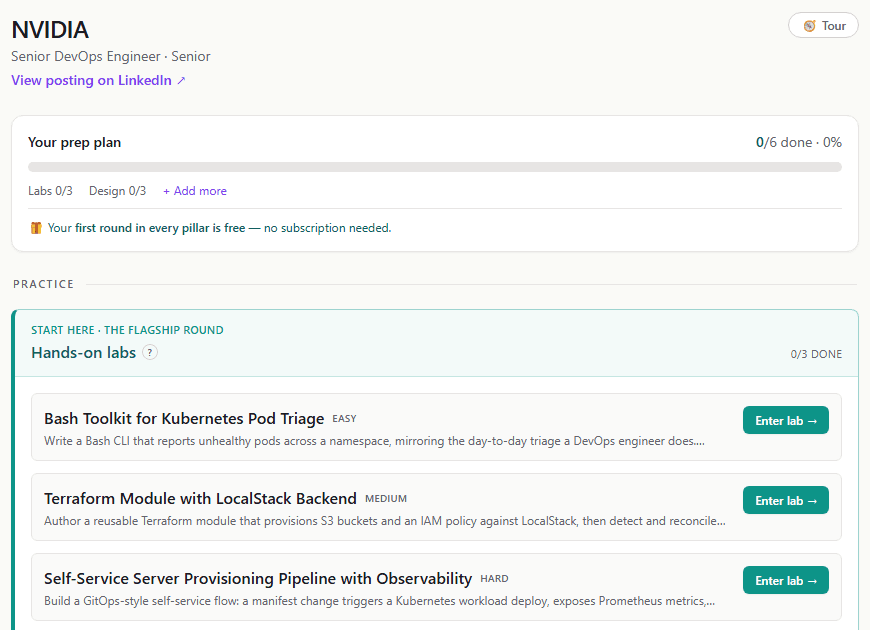
Reading a question bank is the floor, not the ceiling: interviews are increasingly hands-on, and the candidates who pass are the ones who have debugged, deployed, and narrated under pressure before the day. prepme.io turns a pasted job description into a free briefing with hands-on Kubernetes and Terraform labs, a graded architecture design round, and a resume-based mock interview, so your practice matches the specific role rather than a generic syllabus.
What DevOps interviews test at each seniority level
A single DevOps loop can touch Linux internals, networking, containers, Kubernetes, Terraform, CI/CD, a cloud provider, and monitoring — and no interviewer expects mastery of all of it. Junior candidates are tested on fundamentals — Linux, git, basic scripting, what a container actually is — plus evidence they can learn fast. Mid-level candidates must wire systems together and debug them: read a pipeline, explain how a request reaches a pod, fix a broken deploy. Senior candidates are graded on judgment — architecture trade-offs, blast-radius thinking, incident command, and the ability to say what they would not build. The same question escalates cleanly: a junior defines a rolling update, a mid-level engineer explains how readiness probes gate it, and a senior explains when they would choose canary instead and which metric triggers the rollback.
The most reliable seniority tell is diagnostic order. Strong candidates state what they would check first and why, name the exact command, and interpret its output before moving on; weak candidates list every possible cause in no particular order. The second tell is honest scoping: "I have not run Istio in production, but here is how I would evaluate it" consistently outscores a bluffed answer, because interviewers probe one level deeper than whatever you claim.
- Junior: Linux, git, scripting basics, container fundamentals, and one project you can defend in depth.
- Mid: connect the pieces — pipelines, Kubernetes objects, IaC — and debug them with the right commands.
- Senior: trade-offs, cost, security posture, incident leadership, and designing systems other people can operate.
- All levels: a stated diagnostic order and honest scoping beat encyclopedic recall.
How a typical DevOps interview loop is structured
Most loops follow the same shape. A recruiter screen checks logistics and rough fit. A technical phone screen of 45 to 60 minutes mixes rapid-fire fundamentals — Linux, networking, containers — with a small scripting exercise. Then comes some form of hands-on round: a live troubleshooting session in a deliberately broken environment, a take-home that builds a small pipeline, or pair-debugging with an engineer. Mid and senior loops add an infrastructure design round — "design the deployment platform for fifty microservices" on a whiteboard — and every loop ends with behavioral interviews with the hiring manager and future teammates.
The mix varies by company: startups lean on the hands-on round, larger companies weight design and behavioral more heavily, and a few add an algorithms round borrowed from their software loop. Ask the recruiter exactly what each session covers — they will tell you, and preparing for the actual format is worth more than another week of general review. The sections below map to the rounds: fundamentals for the screen, the domain sections for the deep dives, the scenario section for the hands-on, and the behavioral section for the close.
- Recruiter screen → technical screen → hands-on troubleshooting → design round (mid/senior) → behavioral.
- The technical screen filters on Linux, networking, and scripting speed; do not under-prepare it.
- Hands-on rounds are increasingly live broken-environment debugging, not slide questions.
- Always ask the recruiter for the format of each round — then prepare that exact format.
Linux and scripting fundamentals
Every DevOps screen tests Linux, because everything else runs on it. Expect processes and signals (what SIGTERM versus SIGKILL means for graceful shutdown), filesystems and permissions, systemd (systemctl status, journalctl -u), networking basics (ss -ltnp, ip a, curl -v), and resource triage (top, df -h, free -h). The questions are rarely exotic; the bar is fluency — the interviewer watches whether ss or lsof comes out unprompted when they say "something is already listening on 8080".
Scripting is the other filter. You will parse a log, glue two APIs together, or automate a cleanup — in bash or Python, your choice, and the choice itself is a talking point: bash for short glue, Python once logic or error handling gets real. Safe-bash idioms (set -euo pipefail, quoted variables, trap for cleanup) mark practitioners. Write scripts during prep rather than reading about them; the muscle memory is the deliverable. The scripting questions below — the log pipeline, the pipefail question, cron debugging — are the exact shapes screens reuse.
- Know cold: ss/lsof, df/du, journalctl, ps/top, kill and signal semantics, file permissions.
- systemd literacy — status, enable vs start, unit dependencies — is assumed at every level.
- One-liner text processing with awk, sort, uniq, and grep appears in a large share of screens.
- Bash for glue, Python for logic; be ready to defend where you draw the line.
Containers and Kubernetes
Container questions start below Kubernetes: image layers and caching, CMD versus ENTRYPOINT, multi-stage builds, why PID 1 signal handling matters, and what namespaces and cgroups actually isolate. Get these right and the Kubernetes conversation goes better, because half of pod debugging is container fundamentals wearing YAML. The questions below cover that Docker layer plus cluster architecture — the control plane components and how they cooperate — which the deeper guides assume.
Kubernetes itself is deep enough that we keep two dedicated guides. Our guide to Kubernetes Interview Questions and Answers covers the full object model — Deployments, Services, probes, RBAC, requests and limits, multi-tenancy — with model answers pitched at each seniority level. Our Kubernetes Troubleshooting Interview Questions guide walks the fix-it-live round: CrashLoopBackOff, Pending pods, OOMKilled, broken Services, and the describe/events/logs workflow that senior interviews are won on. If the job description says Kubernetes, work both after this page.
- Docker layer: images and caching, ENTRYPOINT/CMD, multi-stage builds, signal handling as PID 1.
- Cluster layer: control plane components, scheduling, and the reconciliation model.
- Depth lives in the Kubernetes guide (objects, RBAC, networking) and the troubleshooting guide (live debugging).
Infrastructure as code and Terraform
IaC questions test two layers. The conceptual layer — why declarative beats imperative, what idempotency guarantees, why immutable infrastructure kills configuration drift — frames every answer and is covered in the questions below. The tool layer is almost always Terraform: state and locking, plan versus apply discipline, modules and environment layout, drift and import. Interviewers use Terraform as a proxy for whether you understand desired-state systems in general, which is the same mental model Kubernetes controllers run on.
Our Terraform Interview Questions and Answers guide holds the deep bank — state file internals, remote backends and locking, count versus for_each, import blocks, secrets in state, lock files, and running plan and apply safely in CI — each with model answers and current-version syntax. Work it if the JD names Terraform, OpenTofu, or infrastructure as code generally; the state-management questions in particular separate candidates who have run Terraform on a team from tutorial graduates.
- Concepts first: the declarative model, idempotency, immutability — they frame every tooling answer.
- Terraform specifics — state, locking, modules, drift, CI — live in the dedicated Terraform guide.
- Expect at least one "what could go wrong" question: state corruption, concurrent applies, or an accidental destroy.
CI/CD pipelines and GitOps
Pipeline questions probe whether you can design safe, fast delivery: which stages a pipeline needs and in what order, why you build an artifact once and promote that same artifact through environments, how tests and security scanning gate promotion, and how deployment strategies — rolling, blue-green, canary — trade speed against risk. Git fluency is the substrate: merge versus rebase, branching strategy, and why trunk-based development pairs with continuous delivery all get tested directly.
Our CI/CD Interview Questions and Answers guide covers the deep end: GitOps and the pull-based model, Argo CD versus Flux, secrets in pipelines, supply-chain security, rollback design, and pipeline performance — the material platform-team loops spend most of their time on. On this page, the git and pipeline-design questions below cover the breadth layer that every DevOps loop touches even when the role is not pipeline-focused.
- Core sequence: lint → build → test → scan → publish artifact → deploy → verify; build once, promote the artifact.
- Know one CI system deeply (GitHub Actions, GitLab CI, Jenkins) and the concepts portably.
- GitOps, Argo CD vs Flux, supply-chain controls, and rollback depth live in the CI/CD guide.
Cloud and AWS
Nearly every JD names a cloud, and AWS is the most common. Interviewers test whether you can make provider-level judgments: which compute abstraction fits (EC2, ECS, EKS, Lambda), how IAM least privilege actually gets implemented, how a VPC is laid out and what security groups do, and how to reason about cost without hurting reliability. Provider-agnostic judgment — the shared responsibility model, horizontal versus vertical scaling, multi-AZ thinking — is tested even when the company runs GCP or Azure, and those questions are below.
Our AWS DevOps Interview Questions and Answers guide goes deep on the AWS-specific layer: ECS versus EKS, IRSA and Pod Identity, security groups versus NACLs, why iam:PassRole is dangerous, Auto Scaling groups, cost reduction, and worked scenario debugging like a post-deploy p99 spike. If the role is AWS-flavored, treat that guide as required reading; the judgment transfers to the other clouds with different nouns.
- Provider-agnostic layer: shared responsibility, scaling models, redundancy across zones, managed vs self-hosted trade-offs.
- AWS specifics — IAM, VPC, ECS/EKS, cost, worked scenarios — live in the AWS DevOps guide.
- Multi-cloud claims invite probing; real depth in one cloud beats slogans about three.
Monitoring, SRE, and incident response
Reliability questions appear in every DevOps loop, not just SRE-titled ones. The baseline: what you would monitor on a new service (the four golden signals, below), the difference between paging on symptoms versus causes, what a reasonable alert threshold looks like, and how you behave in an incident — triage order, communication, and the postmortem afterwards. Behavioral rounds often double-dip here with "tell me about an incident you handled", so the same preparation serves twice.
For SRE-titled roles the bar rises to the formal framework: SLIs, SLOs, and error budgets, Prometheus metric types and PromQL, multi-burn-rate alerting, toil budgets, and capacity planning. Our SRE Interview Questions and Answers guide covers all of it with model answers, including a worked p99-latency debugging scenario that shows the method interviewers want to see. Read it even for generalist roles — error-budget vocabulary elevates ordinary monitoring answers.
- Every loop: golden signals, symptom-based alerting, incident triage, blameless postmortems.
- SRE loops add SLO math, error budgets, Prometheus and PromQL, burn rates — see the SRE guide.
- One well-told real incident covers both the technical and behavioral versions of the question.
Troubleshooting scenarios: how to work a live problem
The scenario round has the highest signal in the loop: "the site is down", "the deploy made it slow", "the disk filled overnight" — and the interviewer watches how you work, not whether you land the exact bug. A reliable method: clarify the symptom and scope first (all users or some? since when? what changed?), check recent changes because most incidents follow a deploy or config push, then walk the request path — DNS, load balancer, application, dependencies — verifying each hop with a command rather than an assumption. State hypotheses cheapest-first and test them in order.
Narrate continuously. "I would run kubectl get pods to see whether anything is crashlooping; if that is clean, ss on the app port; if that listens, the load balancer's target health" is a scoring answer even when the interviewer redirects you, because it exposes ordered thinking. Silence, or jumping to an exotic root cause before checking whether the process is even running, is how otherwise strong engineers fail this round. The best preparation is deliberately breaking a sandbox — kill a service, fill a disk, ship a bad image — and rehearsing the narration out loud.
- Method: scope the symptom → check recent changes → walk the request path → hypothesize cheapest-first → verify every step.
- Narrate every move; the reasoning is what is being graded.
- Most production incidents trail a change — always ask what shipped recently.
- Practice on deliberately broken environments, not flashcards.
Behavioral and collaboration questions
DevOps sits on the boundary between development and operations, so behavioral rounds probe boundary skills: how you handled a developer pushing back on a pipeline gate, how you drove adoption of a practice without the authority to mandate it, how you balanced toil reduction against feature requests, and how you communicated during an incident with executives watching. Expect at least one failure question — an incident you caused, a project that slipped, a decision you reversed.
Prepare five or six real stories mapped to the recurring themes: incident ownership, cross-team conflict, automation that paid off, a trade-off under pressure, influencing without authority. Give each a crisp arc — situation, your action in the first person, measurable result, what changed afterwards — without reciting STAR so mechanically it sounds rehearsed. Quantify honestly (deploy time from forty minutes to eight, on-call pages halved) and never trash a former team; interviewers assume you will describe them the same way someday.
- Recurring prompts: an incident you caused, conflict with a developer, driving change without authority, toil vs features.
- Five or six true stories, each with a first-person action and a measurable outcome.
- Blameless language throughout — process fixes, not villain hunts.
Questions you should ask the interviewer
The questions you ask are scored too, informally: they reveal whether you have operated real systems. Ask about operational reality, not perks. "What does the on-call rotation look like, and how many pages did last week generate?" tells you about both the job and the system's health. "How does a change get from a laptop to production, and how long does that take?" surfaces the delivery maturity in one answer. "Walk me through your last significant incident and what changed afterwards" reveals whether postmortems produce fixes or blame.
Listen to how they answer as much as what they say. Hesitation on deploy frequency usually means manual releases; a laugh at the on-call question means a heavy pager. You are evaluating whether the systems you would inherit are a platform or a rescue mission — both can be good jobs, but they are different jobs, and knowing which one you are signing up for is the point of the final ten minutes.
- On-call load, and how pages trended over the last few months.
- Deploy frequency and the path to production — the one-question maturity probe.
- The last major incident, and what concretely changed after it.
- Where the team wants its infrastructure to be in a year — investment or firefighting.
A three-to-six-week preparation plan
Six weeks comfortably covers a full loop for someone with some experience; compress to three by cutting to your weakest areas. Weeks one and two: Linux and scripting daily — one text-processing kata and one debugging exercise per day — plus container fundamentals until image builds and signal handling are automatic. Weeks three and four: Kubernetes and your target cloud; alternate concept review with hands-on breaking-and-fixing in a sandbox cluster, then layer in Terraform and pipeline design. Weeks five and six: design-round practice on a whiteboard, behavioral stories written and rehearsed out loud, and full mock interviews under time pressure.
Two habits multiply the plan's value. First, practice out loud: the gap between knowing and articulating is where interviews are lost, and narration only improves by doing it. Second, prep against the actual job description rather than a generic syllabus — the JD tells you which of the sections above deserve your depth. That targeting is exactly what prepme automates: paste the JD and we generate hands-on labs, a graded design round, and a resume-based mock interview matched to the role's stack, so your reps land where the interview will.
- Weeks 1-2: Linux, scripting, containers — daily katas until the commands are reflexes.
- Weeks 3-4: Kubernetes and your target cloud hands-on, then Terraform and CI/CD design.
- Weeks 5-6: design rounds, behavioral stories, timed mock interviews.
- Throughout: read the JD, weight your time by what it names, and practice narrating out loud.
Common interview questions & answers
What is DevOps?
DevOps is a set of practices and a working culture that closes the gap between writing software and operating it — not a job title bolted onto a sysadmin role, even though the industry hires for it that way. The core idea: the team that builds a service shares responsibility for running it, supported by automation that makes releases small, frequent, and reversible. The CALMS framing organizes a strong answer: Culture (shared ownership, blameless postmortems), Automation (CI/CD, infrastructure as code), Lean (small batches, fast feedback), Measurement (metrics, monitoring, DORA-style delivery indicators), and Sharing (knowledge spreading across dev and ops). Contrast it with the old model — developers throw a build over the wall, operations absorbs the pages — and name the payoff: shorter lead time and lower change-failure rate together, not one traded for the other. Interviewers open with this to hear whether you frame DevOps as culture plus practices or reduce it to a toolchain.
What is the difference between continuous integration, continuous delivery, and continuous deployment?
Continuous integration means every change merges to the shared mainline frequently — at least daily — and each merge triggers an automated build and test run, so integration problems surface in minutes rather than at release time. Continuous delivery extends that pipeline until every change that passes is proven deployable: the artifact is built, tested, and staged so that shipping to production is a business decision executed by pressing a button. Continuous deployment removes the button — every passing change deploys to production automatically, with no human approval in the path. The distinction interviewers listen for is delivery versus deployment: delivery guarantees you can release at any moment; deployment means you actually do, which demands strong automated tests, fast rollback, and production monitoring you trust. A good closing note: most teams should reach continuous delivery, while continuous deployment is a further step that suits some products and risk profiles, not a maturity badge every team needs.
What is the difference between a container and a virtual machine?
A virtual machine virtualizes hardware: a hypervisor runs a full guest operating system, with its own kernel, per VM. A container virtualizes the operating system: every container on a host shares the host kernel and is isolated by namespaces, which limit what a process can see (PIDs, network interfaces, mounts), and cgroups, which limit what it can use (CPU, memory, IO). That is why containers start in milliseconds and cost megabytes while VMs boot an entire OS and cost gigabytes. The trade-off is a weaker isolation boundary: a kernel exploit inside a container can reach the host, which is why hard multi-tenant platforms put VMs underneath containers or use sandboxed runtimes like gVisor or Kata. A strong answer names the primitives — namespaces, cgroups, and union filesystems for layered images — rather than calling containers lightweight VMs, and notes that in most clouds your Kubernetes nodes are themselves VMs, so production runs both at once.
What are the main components of the Kubernetes control plane, and what does each do?
A Kubernetes cluster splits into a control plane and worker nodes. The control plane runs the API server, etcd, the scheduler, and the controller manager; every node runs the kubelet and kube-proxy. The API server is the single front door: every kubectl command and every controller goes through it, and it is the only component that reads and writes etcd, the consistent key-value store holding all cluster state. The scheduler assigns unscheduled pods to nodes based on resource requests, affinity, and taints. The controller manager runs the reconciliation loops — Deployment, ReplicaSet, node, and job controllers among others — that drive actual state toward desired state. On each node the kubelet starts and monitors the containers for pods assigned to it, and kube-proxy programs the rules that make Service virtual IPs route to pods. The interview-grade detail: nothing talks to etcd directly, and controllers act on what they observe through watches, not on commands — which is why the system is self-healing.
What is the difference between CMD and ENTRYPOINT in a Dockerfile?
ENTRYPOINT sets the executable the container always runs; CMD supplies its default arguments — or the entire default command when no ENTRYPOINT is set. Arguments given to docker run replace CMD but are appended after ENTRYPOINT, so ENTRYPOINT ["nginx"] with CMD ["-g", "daemon off;"] runs nginx with those flags by default while letting a caller swap just the flags. In Kubernetes the mapping trips people up: command: overrides ENTRYPOINT and args: overrides CMD. Always prefer the exec form (the JSON array) over shell form: shell form wraps your process in /bin/sh -c, so the shell becomes PID 1 and does not forward SIGTERM. Your application never sees the stop signal, gets SIGKILLed when the termination grace period expires, and drops in-flight requests on every rolling deploy. Interviewers ask this less for the syntax than for that consequence — it separates people who have debugged ungraceful shutdowns from people who have only read the Dockerfile reference.
What is a multi-stage Docker build, and how do you keep images small?
A multi-stage build uses multiple FROM statements in one Dockerfile: an early stage compiles the application with the full toolchain, and the final stage starts from a minimal base and pulls in only the artifact with COPY --from=build. The shipped image contains the binary and its runtime dependencies — no compilers, no source, no package caches — so it is smaller, faster to pull, and has far less attack surface to patch. Pair it with layer-cache discipline: order instructions from least to most frequently changing, and COPY the dependency manifest (package.json, go.mod, requirements.txt) and install before copying source, so an ordinary code change does not invalidate the dependency layer. Then choose the smallest workable base — distroless or alpine instead of a full distribution — and add a .dockerignore so the build context stays lean. A Go service shipped as a full Ubuntu image typically shrinks to a few tens of megabytes this way with no functional change.
A production server's disk is full. How do you find and fix the cause?
Confirm the symptom first: df -h shows which filesystem is actually full — a full /var with a roomy / sends you to a different place. Then walk down the tree with du -xh --max-depth=1 /var | sort -h to find the heavy directory; the usual suspects are application logs, the journal (journalctl --vacuum-size=500M), and Docker (docker system df, then docker system prune with care). If df says full but du cannot find the space, a process is holding deleted files open — lsof +L1 lists them, and restarting that process releases the space. Never rm an active log file: the writer keeps the inode open and nothing is freed; truncate it instead with : > app.log. Also check inode exhaustion with df -i, because millions of tiny files can fill a disk that df -h calls half empty. Close with prevention: logrotate, retention policies, and an alert at 80 percent, not 95.
How do you find which process is using a port, or eating all the CPU, on a Linux host?
For a port: ss -ltnp | grep :8080 shows the listening socket with its PID and process name; lsof -i :8080 gives the same answer. For CPU: top or htop for the live view, ps aux --sort=-%cpu | head for a snapshot, and pidstat 1 from sysstat to watch per-process usage over time rather than one instant. With the PID in hand, /proc/<pid>/ exposes almost everything — cwd, cmdline, open file descriptors — and strace -p attaches to see what the process is actually doing, with the caveat that strace slows its target and deserves care on a production box. Two interpretation traps are worth naming unprompted: high iowait means the CPU is idle waiting on disk, which is a storage problem, not a compute problem; and a multi-threaded process legitimately shows 400 percent CPU on a four-core host. Interviewers listen for tool fluency plus that interpretation layer on top.
What does set -euo pipefail do at the top of a bash script, and why does it matter?
set -e exits the script when a command returns non-zero instead of blundering on; set -u makes referencing an unset variable an error instead of a silent empty string; set -o pipefail makes a pipeline fail when any command in it fails — the exit status becomes the rightmost non-zero exit code in the pipe — instead of reporting only the final command's status. The motivating bugs are classics: curl piped to jq succeeds as far as bash is concerned even when curl failed, because jq exited zero — pipefail fixes exactly that — and rm -rf "$PREFIX/" with an unset PREFIX becomes rm -rf / without -u. The honest caveats matter in an interview: -e has documented blind spots (failures inside if conditions, command substitutions, or on the left of ||), so critical steps still deserve explicit checks, and cleanup belongs in a trap on EXIT so it runs on failure paths too. Add that you run shellcheck in CI and you have answered like a practitioner.
How would you extract the top 10 client IPs from a web server access log?
The classic pipeline: awk '{print $1}' access.log | sort | uniq -c | sort -rn | head -10. awk pulls the client-IP field, the first sort groups identical IPs into adjacent lines because uniq -c only counts adjacent duplicates, the second sort -rn orders by count descending, and head takes the top ten. Explaining why the first sort must exist is the real test — it shows you understand the tools rather than reciting an incantation. For a huge file, one pass beats two sorts: awk '{c[$1]++} END {for (ip in c) print c[ip], ip}' access.log | sort -rn | head -10 counts in an associative array. Expect variations: filter a time window first with grep, count status codes instead (field $9 in the combined log format), or switch to Python when parsing gets ugly. This exercise is a screen staple in some form — filter, count, rank — so drill it until it is automatic.
A systemd service fails to start after a reboot. How do you debug it?
Start with systemctl status myservice — it shows the state, the last exit code, and the most recent log lines in one screen. Then read the full story with journalctl -u myservice --since "1 hour ago" (or -b for everything since boot, -xe for the tail with context). The failure mode narrows the search: a bad ExecStart path or permission problem fails instantly, a missing environment variable surfaces in the application's own error output, and a dependency problem appears as the service starting before something it needs — fixed with After= and Wants= on the right target, network-online.target being the classic for network-dependent services. Inspect the effective unit with systemctl cat myservice, and remember the enabled-versus-started distinction: a service that runs fine when started manually but is missing after reboot was never enabled with systemctl enable. Repeated restarts are governed by Restart=, RestartSec=, and StartLimitBurst — status tells you when the start limit tripped.
A cron job did not run last night. How do you find out why?
First establish whether it ran at all: grep CRON /var/log/syslog (Debian/Ubuntu; /var/log/cron on RHEL-family) or journalctl -u cron --since today (the unit is crond on RHEL-family) shows every invocation, which separates never started from started and failed. If it never started, check the obvious: crontab -l as the expected user (root's crontab is not yours), a schedule that does not mean what you think, or a crontab file missing its trailing newline. If it started and failed, the culprit is usually cron's minimal environment: PATH is just /usr/bin:/bin, no interactive profile loads, and HOME may differ, so a script that works in your shell dies silently under cron. Use absolute paths, set PATH inside the script, and capture output explicitly — */5 * * * * /opt/bin/job.sh >> /var/log/job.log 2>&1 — because by default output is mailed or lost. Name the two traps everyone hits: percent signs must be escaped in crontab lines, and overlapping runs need flock -n.
What is the difference between git merge and git rebase, and what branching strategy do you prefer?
git merge joins two branches with a merge commit and preserves history exactly as it happened; git rebase replays your commits on top of the new base, producing linear history at the cost of rewriting it. The golden rule: never rebase commits others may have pulled — rewriting shared history forces everyone downstream into recovery. A common workflow is to rebase your local feature branch onto main before opening the pull request (git pull --rebase origin main), then land the PR as a squash merge so main stays a clean sequence of reviewable units. If you must push a rebased branch, git push --force-with-lease refuses to clobber commits you have not seen, unlike bare --force. On strategy, be opinionated: short-lived branches merged to trunk frequently beat long-lived GitFlow branches for continuous delivery, because integration pain grows with divergence time. Interviewers ask this to gauge daily git fluency and how you collaborate under review.
What stages does a production CI/CD pipeline need, and in what order?
The core sequence: lint and static analysis first because they are cheapest, then compile or build, unit tests, integration tests, security scanning (dependency audit plus image scan), publish the artifact to a registry, deploy to a staging environment, run smoke or end-to-end verification, then promote to production and verify again with health checks and key metrics. Two principles matter more than the exact list. Fail fast: order stages so the cheapest checks run first and a broken commit dies in seconds, not after a twenty-minute build. Build once, promote the artifact: the exact image or package that passed testing is what reaches production — rebuilding per environment invalidates everything the pipeline proved. Also mention gates between stages (tests gate promotion, staging verification gates production) and that deploy steps should be idempotent and reversible so a failed rollout rolls back cleanly. Interviewers use this question to see whether you design pipelines or just copy templates.
Rolling, blue-green, and canary deployments — how do they differ, and when do you choose each?
A rolling update replaces instances gradually — Kubernetes does this by default, honoring maxUnavailable and maxSurge — so capacity stays up and no second environment is needed, but two versions run simultaneously and rollback means rolling forward through the same process. Blue-green runs a full second environment: deploy to the idle color, verify, then switch traffic at the router in one cut. Rollback is instant — point traffic back — but you pay for double capacity and the database schema must work for both versions during the switch. Canary sends a small slice of real traffic — say five percent — to the new version, watches error rate and latency against the baseline, and expands or aborts on the evidence. Choose rolling as the cheap default, blue-green when instant rollback justifies the cost, and canary for high-traffic services where metrics can catch regressions before most users see them. The senior detail: every strategy is only as safe as its rollback path and compatibility story.
What is idempotency, and why does it matter so much in DevOps tooling?
An operation is idempotent when applying it once or ten times produces the same result. It is the property that makes modern infrastructure tooling safe: terraform apply on an unchanged configuration makes no changes, a correct Ansible playbook reports ok rather than changed on its second run, and a Kubernetes controller can reconcile the same desired state forever without side effects. Contrast a raw script that appends a line to a config file — run it twice and the file is wrong. Idempotency is what lets you retry after a partial failure, re-run an entire pipeline without fear, and converge a drifted system back to its declared state, which is the whole infrastructure-as-code model. In scripts you get it by checking state before changing it — mkdir -p, install-if-absent guards, declarative statements over imperative edits — and in APIs through PUT-like semantics or idempotency keys. Interviewers ask because the answer reveals whether you think declaratively or procedurally.
What is the difference between mutable and immutable infrastructure?
Mutable infrastructure is modified in place: you SSH in, patch packages, edit configs, and over months each server accumulates undocumented differences — the snowflake problem, where no two supposedly identical machines behave alike. Immutable infrastructure never modifies a running server: you bake a new image (an AMI, a container image), roll it out alongside the old version, shift traffic, and destroy the old instances. Deployment becomes replacement, rollback becomes redeploying the previous artifact, and configuration drift cannot accumulate because nothing is ever edited live. Containers made this the default model — a container image is immutable by construction — and golden-image pipelines with Packer do the same for VMs. The honest trade-offs: you need an image build pipeline and artifact storage, hot-patching a live box is off the table, and stateful systems like databases still require careful in-place operations. The pets-versus-cattle framing summarizes the shift well in an interview setting.
Explain the cloud shared responsibility model with a concrete example.
The shared responsibility model divides security between the provider and you: the provider secures the cloud itself — physical datacenters, hardware, the hypervisor, the internals of managed services — while you secure what you put in it: your data, identity and access management, network rules, and configuration. The line moves per service, and that movement is what interviewers probe. On EC2 you patch the guest OS yourself; on RDS the OS and database patching are AWS's job while users, encryption choices, and network access remain yours; on S3 and Lambda nearly everything left to you is configuration and IAM. The practical punchline is that most real cloud incidents are customer-side misconfiguration — public buckets, over-broad IAM policies, security groups open to the world — not provider failures. Naming which side of the line a given control sits on, per service, is what a strong answer sounds like in practice.
Vertical versus horizontal scaling — when do you choose each?
Vertical scaling gives one machine more CPU, memory, or disk; horizontal scaling adds more machines. Vertical is operationally simple and needs no architecture change, but it has a hardware ceiling, usually requires a restart to resize, and leaves a single point of failure. Horizontal scales much further and buys redundancy, but demands that the tier be stateless: sessions move to something like Redis, uploads to object storage, traffic through a load balancer — and you inherit distributed-system concerns along the way. The standard architecture scales stateless application tiers horizontally behind a balancer and treats the database as the hard part: vertical first, then read replicas, then sharding only when forced, because sharding is an application change disguised as an infrastructure change. In Kubernetes terms, the Horizontal Pod Autoscaler adds pods, the Vertical Pod Autoscaler resizes them, and the cluster autoscaler adds nodes underneath. Naming where state lives is what makes the answer senior.
Walk me through what happens when a user requests https://example.com.
Walk the request path in order and name where you would debug each hop. DNS: the browser and OS caches are checked, then the configured resolver recursively walks root, TLD, and authoritative servers to return a record with a TTL — dig +trace example.com shows the whole chain. TCP: a three-way handshake to that IP on port 443. TLS: the client sends SNI, validates the certificate chain, and negotiates session keys — curl -v https://example.com prints the handshake and is the first tool when a site being down is really an expired certificate. HTTP: the request typically lands on a CDN or load balancer, forwards to an application instance, which may call databases and caches before responding. The DevOps version of this answer is not browser rendering trivia; it is knowing which layer a given symptom implicates — NXDOMAIN, connection refused, certificate error, 502 — and which command confirms each hypothesis.
Your load balancer is returning 502, 503, or 504. What does each code tell you?
All three come from a proxy or load balancer describing its conversation with your backend. 502 Bad Gateway: the upstream returned something invalid or reset the connection — the process crashed mid-request, the target port is wrong, or nothing is listening, giving connection refused. 503 Service Unavailable: there is no healthy backend to send to — every target is failing health checks, a Kubernetes Service has zero ready endpoints, instances deregistered mid-deploy, or the application is deliberately shedding load. 504 Gateway Timeout: a backend accepted the request but did not answer within the proxy's timeout — a slow database query, an exhausted connection pool, or a timeout mismatch where the load balancer gives up before the application finishes. Triage follows the code: for 503 check target health and ready endpoints first; for 502 check whether the process is alive and listening on the right port; for 504 compare latency metrics and timeout settings layer by layer.
What are the four golden signals, and how would you apply them to a new service?
The four golden signals come from the Google SRE book: latency, traffic, errors, and saturation. Latency is how long requests take, always tracked as percentiles (p50, p95, p99) because averages hide the pain, and measured separately for successes and failures, since fast errors flatter the numbers. Traffic is demand — requests per second, concurrent connections — the context that makes the other signals interpretable. Errors are failed requests: explicit 5xx plus the quieter failures like wrong content or responses too slow to count as success. Saturation is how full the constraining resource is — connection pool, CPU, memory, disk — and it matters because it leads: latency degrades as utilization approaches its ceiling, so saturation warns before users hurt. For a new service, instrument these four before anything else, page on user-visible symptoms like error rate and latency against the SLO, and route saturation to capacity tickets. RED and USE are variants worth naming.
Tell me about a time you caused a production incident. How should you answer this?
The interviewer is testing ownership and systemic thinking, not hunting for a flawless record — claiming you have never caused an incident reads as inexperience or evasion. Structure the story: one line of context, what happened, and your role stated plainly in the first person ("I shipped the config change that took checkout down"), then honest impact — duration, blast radius, who noticed. Spend most of the time on detection, mitigation, and what changed afterwards: the alert that now catches the failure class, the guardrail added to the pipeline, the runbook you wrote. That last part separates strong answers, because it shows you convert failure into system improvements rather than personal guilt. Keep the timeline crisp, never blame a teammate, and use blameless-postmortem language — the process allowed the mistake, so you fixed the process. Pick an incident with a genuine lesson and practice telling it in under three minutes.
Practice this for real, from your target job
A question bank shows you what interviews ask; it cannot watch you work. Paste a job description into prepme and we generate a briefing for that exact role: hands-on Kubernetes and Terraform labs in a real terminal, a graded architecture design round, and a mock interview built from your resume. Generating the briefing is free, so you practice against the job the interview is actually for.
FAQ
How long does it take to prepare for a DevOps interview?+
With daily hands-on experience, one to two focused weeks of review and mock practice is usually enough. Switching into DevOps or returning after a gap, plan four to six weeks: Linux and scripting first, then Kubernetes and your target cloud hands-on, then design rounds and timed mocks. The constraint is hands-on rep count, not reading volume — interviews reward people who have recently broken and fixed real systems.
What should I learn first if I am new to DevOps?+
Linux, then git, then one scripting language, in that order — everything else stands on them. After that: containers, one cloud provider, Kubernetes, Terraform, and CI/CD, ideally by building one small project that touches all of them end to end. A single deployed, monitored application teaches more than parallel courses on each topic.
Do DevOps interviews include live coding?+
Usually scripting rather than algorithms: parse a log, call an API, automate a task in bash or Python while sharing your screen. Pure algorithm rounds are uncommon for DevOps roles but do appear at some larger companies that reuse their software-engineering loop — ask the recruiter which format to expect and prepare that.
Which certifications actually help in DevOps interviews?+
The CKA carries the most interview-relevant weight because its exam is hands-on kubectl work, which transfers directly to troubleshooting rounds. AWS certifications signal baseline cloud literacy on resume screens. None substitute for demonstrable experience: certifications open doors at the screening stage, but the interview itself tests whether you can operate systems.
How do junior and senior DevOps interviews differ?+
Junior loops test fundamentals and learning speed: Linux, git, scripting, container basics, one honest project you can discuss in depth. Senior loops assume the fundamentals and test judgment: architecture trade-offs, incident leadership, cost and security reasoning. The same topic escalates — a junior explains a rolling update, a senior explains when to canary instead.
How do I prepare for a specific company's stack?+
Start from the job description, not a generic syllabus — it names the stack the loop will probe. On prepme.io you paste the JD and get a free briefing with hands-on labs, a design round, and a resume-based mock interview matched to that role, plus a free Company Coverage card that researches the employer.
Related guides
- Kubernetes Interview Questions and AnswersKubernetes interview questions with model answers: pods, Deployments, Services, Ingress, RBAC, probes, plus live debugging of CrashLoopBackOff, Pending, and OOMKilled.
- Kubernetes Troubleshooting Interview QuestionsSenior Kubernetes troubleshooting interview questions with model answers: debug CrashLoopBackOff, Pending pods, probes, OOMKilled, RBAC, and stuck rollouts.
- Terraform Interview Questions and AnswersTerraform interview questions with model answers: HCL, state and locking, modules, workspaces, drift, import, providers, and plan/apply in CI — plus hands-on labs.
- AWS DevOps Interview Questions and AnswersReal AWS DevOps interview questions with strong model answers: ECS vs EKS, VPC and IAM least-privilege, Terraform vs CloudFormation, CI/CD, scaling, and incidents.
- CI/CD Interview Questions and AnswersCI/CD interview questions with model answers: pipelines, blue-green vs canary, GitOps, Argo CD vs Flux, secrets, rollbacks, and supply-chain security.
- SRE Interview Questions and AnswersSRE interview questions with model answers: SLIs, SLOs, error budgets, observability, incident response, and a worked production-debugging scenario.